Canada just did something it's never done before: its population shrank. Buried inside that headline is a bigger story. One province is booming while the two largest are losing residents fast. Here's what that means for housing, market by market.
The National Number Doesn't Tell You Much

Canada's population fell 0.25% in Q1 2026, that's 103,500 people, following the country's first-ever annual decline in 2025 (Statistics Canada). Easy to read that as "the whole country is slowing down." Not quite right, though. That national figure is an average of some very different local realities, and it's the local realities that actually move housing markets, benchmark prices, active listing counts, and days on market. This is the first post in a series…

246 Views, 0 Comments
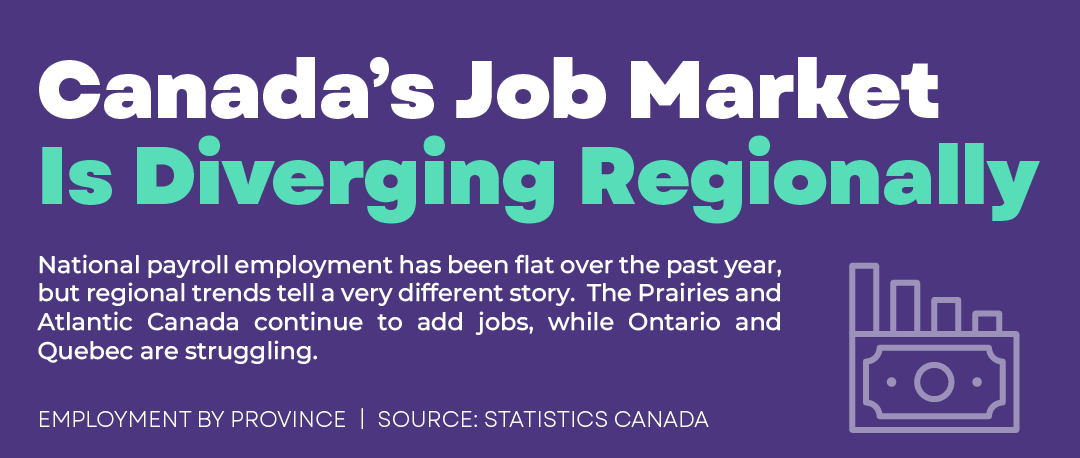
Canada's job market has split, and the dividing line runs right through the middle of the country. Saskatchewan is leading the nation at +1.7% payroll employment growth. Alberta is close behind at +1.3%. Meanwhile, Ontario is shedding payroll jobs at -0.4% and Quebec at -0.5%. The Prairies are hiring. Central Canada is not. And for anyone making a real estate decision right now, that regional divide changes everything.


The Data Behind the Divide

Statistics Canada's February 2026 payroll employment data tells a story the national headline completely hides. Here's how every region stacks up year-over-year:

Growing employment:

  • Saskatchewan: +1.7% — strongest in Canada
  • Alberta: +1.3% — second strongest in Canada
  • Atlantic Canada:…

117 Views, 0 Comments

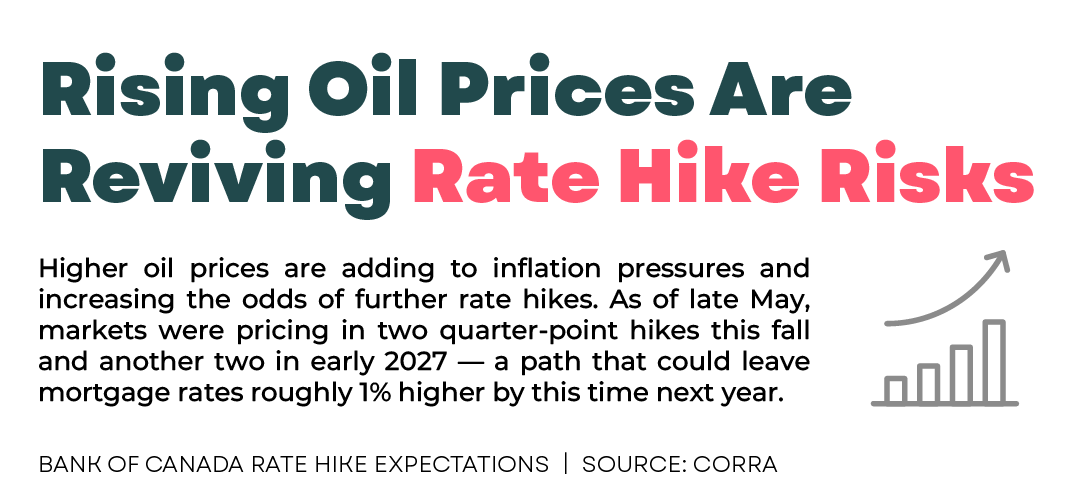
If you've been waiting for interest rates to fall further before making your move in real estate, here's the update you need to hear: the Bank of Canada's rate cutting cycle is over. Rates reached their cycle low in early 2026 and have been holding flat ever since. But market projections are now pointing in one direction. Up. Rising oil prices are feeding back into inflation expectations, and the window of maximum affordability that opened during the cutting cycle is quietly starting to close.

What the Rate Chart Is Actually Telling You

The data tells a clear two-part story. Here's what actually happened and what the market is now projecting.

What happened (January 2025 to April 2026, actual Bank of Canada data):

  • Rates started near the…

105 Views, 0 Comments

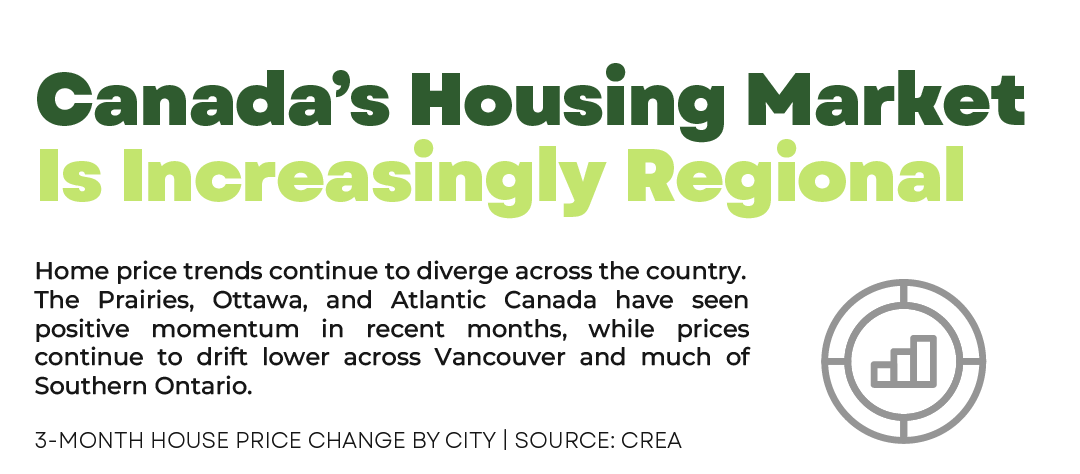
That's not a bait to get you to click, it’s just not an intentional lie. The problem is the headlines are answering the question. According to CREA's 3-month seasonally adjusted price data from January to April 2026, Vancouver has shed approximately 3.0% in home value while Halifax has gained 1.3%. Both are happening right now, in the same country, under the same interest rate environment. If you're making a real estate decision based on what "the Canadian market" is doing, you're asking the wrong question. The right question is: what is your city doing?

The National Average Is Lying to You

Canada's national 3-month price change sits at approximately -1.0% as of April 2026. That number is technically accurate and almost completely useless for…

165 Views, 0 Comments

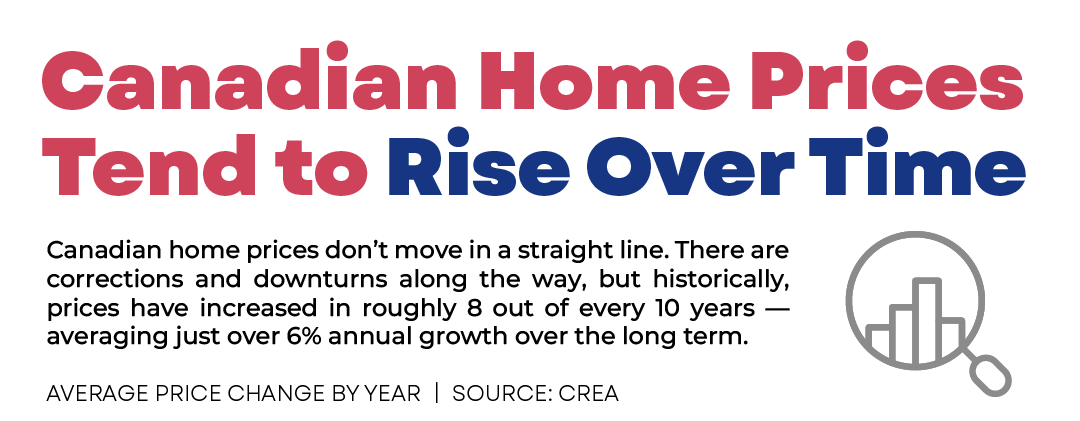
If you want to understand where Canadian real estate is headed, the best place to start is where it's been. Forty-seven years of annual price data from the CREA MLS dataset, covering 1980 all the way through 2026, tells a story that's more reassuring, more nuanced, and more useful than anything you'll read in today's headlines. And once you see the full picture, the current soft correction looks a lot less alarming.

The Opening Chapter: 1980 to 1995

The story starts with a bang. Canadian home prices jumped +18.9% in 1981, one of the strongest single-year gains in the entire dataset. But what goes up in an overheated market often pulls back, and 1982 brought a -2.7% correction as interest rates spiked dramatically. Sound familiar?

What's…

1782 Views, 0 Comments

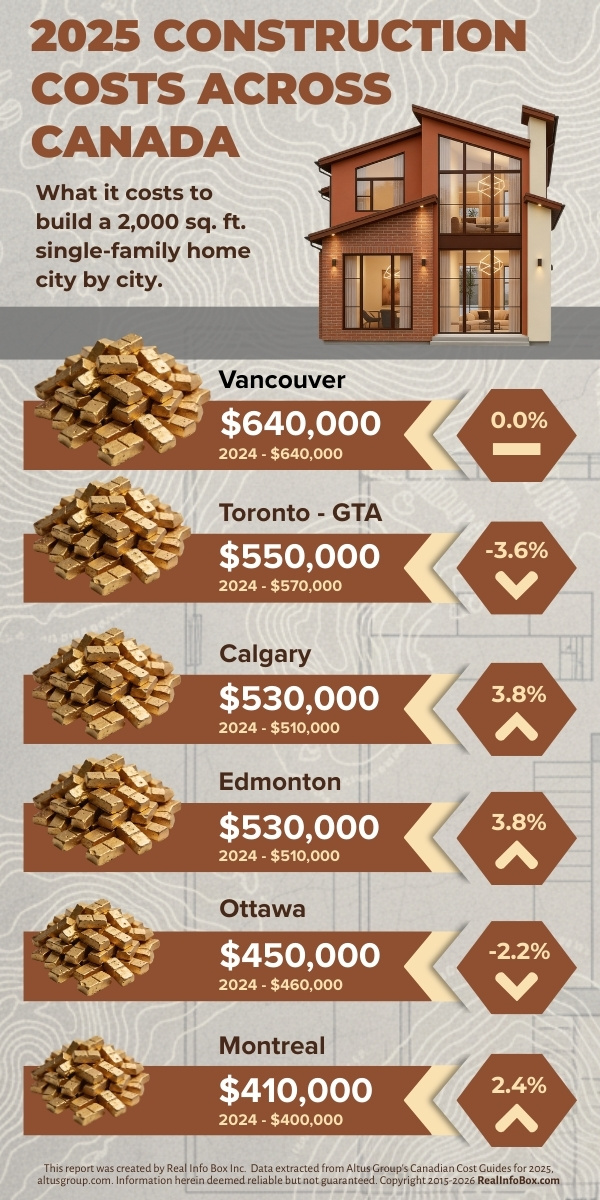
Here's a number that'll stop you mid-scroll: building the exact same 2,000 sq. ft. home costs $230,000 more in Vancouver than it does in Montreal. Same size. Same building type. Completely different price tag.

That gap tells you more about how Canadian construction pricing actually works than any national average ever could.

All figures below come straight from Altus Group's Canadian Cost Guide for 2025. Here's what's changed, and what hasn't.

The 2025 New Home Construction Costs, City by City

The benchmark: a 2,000 sq. ft. wood-framed single-family home with an unfinished basement, using the upper-end estimate per city.

What's Actually Driving Costs in Each City

Vancouver: Still the Most Expensive, But Finally Flat

At $640,000,…

2245 Views, 0 Comments

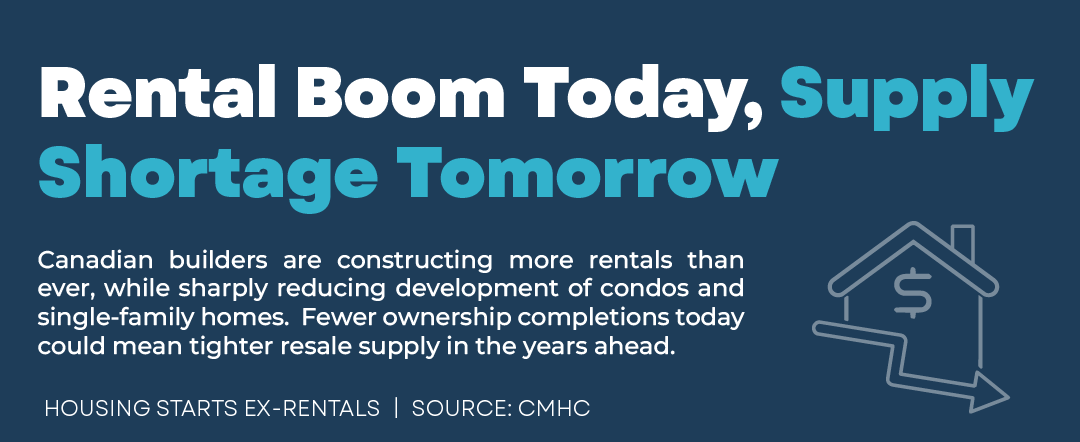
That headline isn't an exaggeration. It's data straight from CMHC. Canadian ownership housing starts have fallen to approximately 100,000 units on a 12-month rolling basis in 2026, matching the lowest level ever recorded in the dataset. The last time the Canadian residential construction sector was here was 2010, right after the global financial crisis. And what happened in the years that followed should be on every buyer's and seller's radar right now.

What "Housing Starts" Actually Means, And Why It Matters

A housing start is counted when construction begins on a new residential unit. The figure CMHC tracks as "ex-rentals" measures specifically the condos and single-family homes that will eventually be available for Canadians to buy, not…

1884 Views, 0 Comments

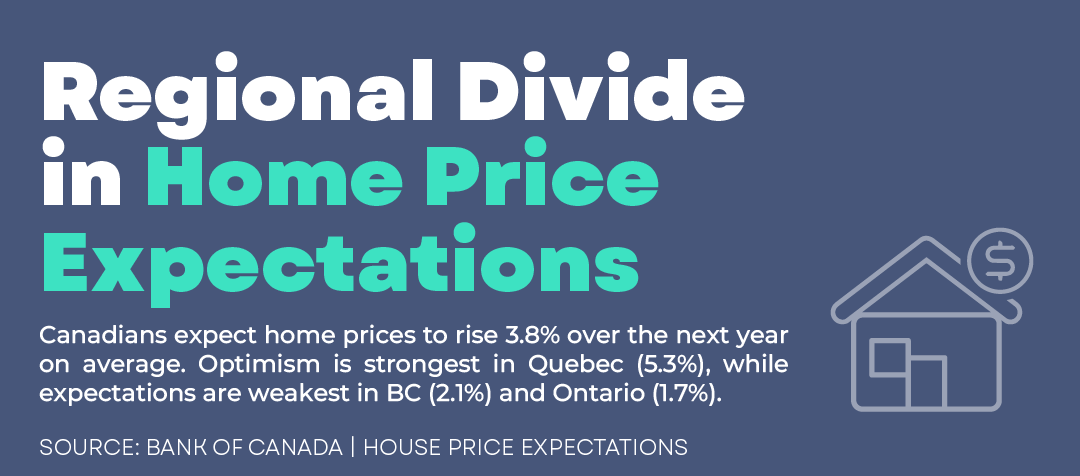
The Bank of Canada's Q1 2026 house price expectations survey answers this question with more clarity than you usually get from national housing data. Quebec at 5.3%. Atlantic Canada near 5%. Manitoba and Saskatchewan close behind. Alberta at 4.1%. All of them running above the national average of 3.8%.

Then there's the other end of the table. Ontario at 1.7%. BC at 2.1%. The two weakest provincial markets in the country, sitting 3.6 percentage points below Quebec's expectation. That's not noise in the data. That's a structural divide, and it creates entirely different strategic realities for buyers and sellers depending on which side of it they're on.

Why Are Ontario and BC Home Prices So Weak in 2026?

If you've looked at the housing market…

1819 Views, 0 Comments

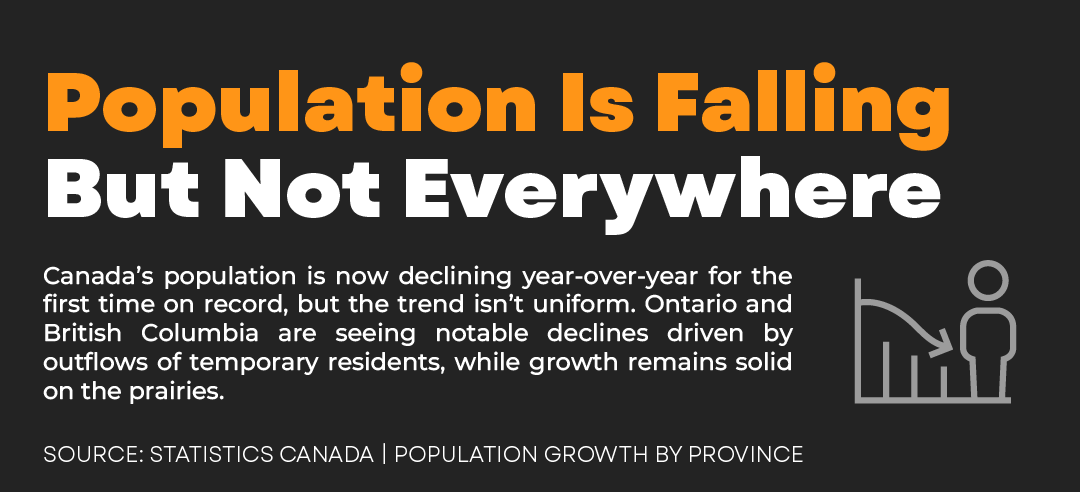
By the end of 2025, Alberta's population shot up by +1.2% year-over-year. Meanwhile, Ontario dipped by -0.7%, and BC dropped -0.75%. These numbers are actively shaping the exact market conditions buyers and sellers are navigating every single day. For the first time since Confederation, Statistics Canada reported that our national population actually shrank in 2025. But here's the catch: it’s not happening everywhere. We’re seeing a massive divide across the country, and figuring out which side of the fence your province sits on is step number one for making smart real estate moves this year.

The Population Divide: Province by Province

Alberta is absolutely leading the pack with that +1.2% growth, thanks to a mix of international newcomers and a…

231 Views, 0 Comments

1 in 6 Canadian Renters Plan to Buy in 2026

About 1 in 6 Canadian renters plan to purchase a home within the next 12 months. That's a real number, not a projection, not a forecast. It's pent-up demand quietly building beneath a market that, on the surface, looks calm.

But here's what the national headline misses.

According to the Bank of Canada's Q1 2026 Survey on Renter Buying Intentions, that demand is wildly uneven across Canada's provincial housing markets. And the gap between the most and least motivated provinces is wider than most buyers and sellers expect.

Manitoba sits at approximately 21% of renters planning to buy. BC sits at just 6.5%. Same country. Same survey. Completely different housing market realities.

Where First-Time…

526 Views, 0 Comments