
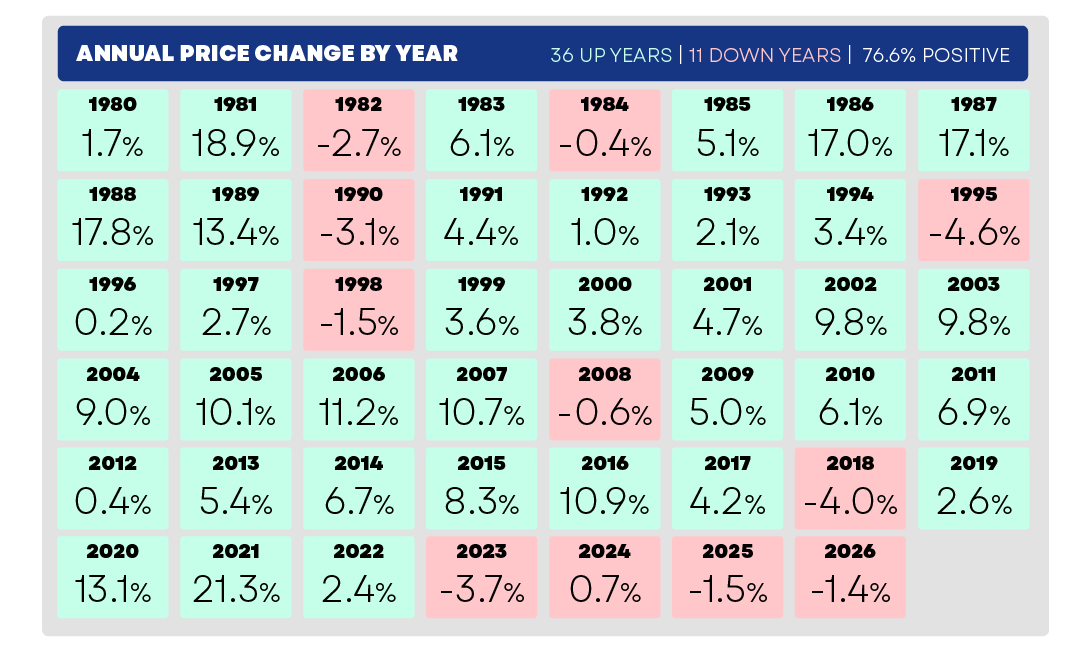
If you want to understand where Canadian real estate is headed, the best place to start is where it's been. Forty-seven years of annual price data from the CREA MLS dataset, covering 1980 all the way through 2026, tells a story that's more reassuring, more nuanced, and more useful than anything you'll read in today's headlines. And once you see the full picture, the current soft correction looks a lot less alarming.

The Opening Chapter: 1980 to 1995
The story starts with a bang. Canadian home prices jumped +18.9% in 1981, one of the strongest single-year gains in the entire dataset. But what goes up in an overheated market often pulls back, and 1982 brought a -2.7% correction as interest rates spiked dramatically. Sound familiar?
What's striking about the 1980s is how quickly the Canadian residential market recovered and kept climbing. After the 1982 dip, the national average sale price rose every single year through the decade, hitting +17.0% in 1986, +17.1% in 1987, +17.8% in 1988, and +13.4% in 1989. A full decade of near-continuous capital appreciation, punctuated by one short cyclical correction.
Then came the early 1990s. A recession, rising unemployment, and higher mortgage rates pushed prices down -3.1% in 1990 and produced a difficult stretch that bottomed out at -4.6% in 1995, the worst single year in the entire 47-year record. At the time, it felt like the market might never recover. It did.
The Middle Chapter: 1996 to 2012
What followed the mid-1990s correction was one of the most sustained growth periods in Canadian real estate history. Starting from a low base in 1996 (+0.2%), the market built momentum quietly, then accelerated.
From 2001 through 2007, Canadian home prices rose every single year without exception, ranging from +4.7% to +11.2%. Seven consecutive years of positive annual appreciation. Buyers who entered the market in 1996 or 1997, when market sentiment was still cautious and affordability had improved significantly from the early 1990s peak, were rewarded with some of the strongest long-term equity gains the Canadian housing market has ever produced.
Then came 2008. The global financial crisis hit every major economy. Canadian home prices dipped just -0.6%, a remarkably shallow annual decline compared to the sustained devastation seen in the U.S. residential market. And within 12 months, Canada was back: +5.0% in 2009, +6.1% in 2010, +6.9% in 2011. The resilience was striking, and it set the stage for everything that followed.
The Recent Chapter: 2013 to 2026
The 2013 to 2019 period was defined by steady, compounding growth. The kind that doesn't make headlines but builds serious equity over a five to ten year holding period. Prices rose every year except 2018 (-4.0%), which turned out to be a brief pause before a historic surge.
Then came the pandemic years. 2020: +13.1%. 2021: +21.3%. The fastest, largest two-year price surge in the entire 47-year CREA dataset, fuelled by the Bank of Canada's emergency overnight rate of 0.25%, a massive shift in housing demand toward larger homes, and a supply base that couldn't keep pace with buyer activity. It was extraordinary. And it was always going to be followed by a correction.
That correction arrived. National average sale prices fell -3.7% in 2023, partially recovered to +0.7% in 2024, then softened again to -1.5% in 2025 and -1.4% in 2026. Back-to-back annual declines for the first time in decades. And yet, even with those figures included, the full 47-year record remains 76.6% positive. Prices rose in 36 of 47 years. The broader story hasn't changed.
Corrections Are Normal. Prolonged Collapses Are Not.
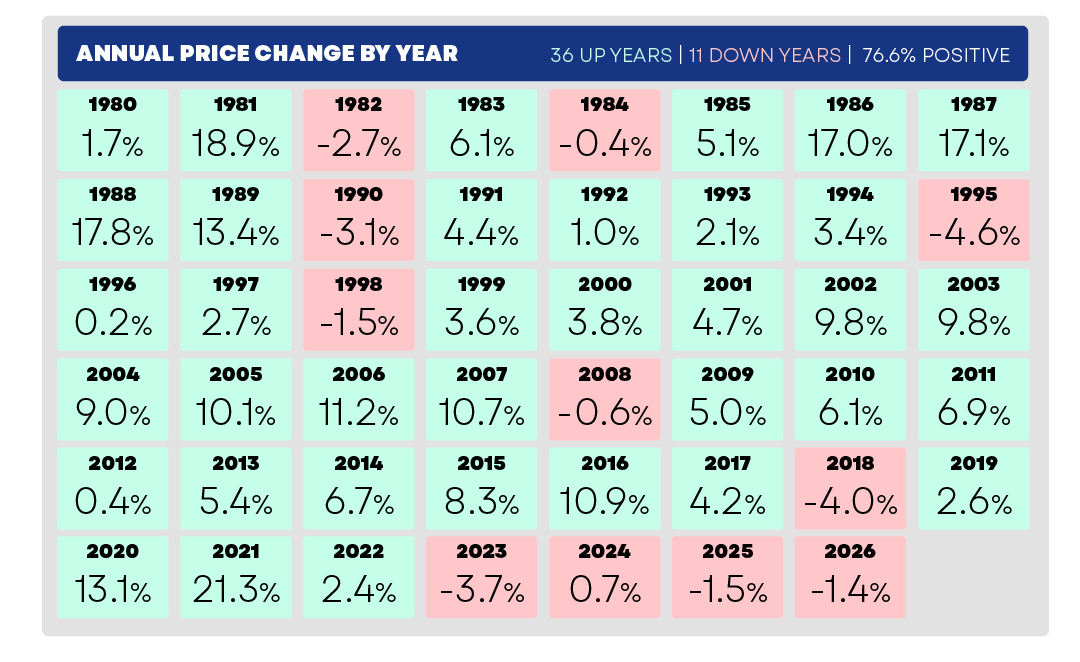
Here's what the data actually shows. Canadian home prices declined in only 11 out of 47 years, and not one of those down years produced a devastating, prolonged collapse. The steepest single-year drop was just -4.6% in 1995. The average annual decline across all 11 negative years was less than 2.5%.
Compare that to the U.S. residential market after 2008, where prices fell for years and took nearly a decade to fully recover. Canada's experience has been fundamentally different, and that's not a coincidence. Stricter mortgage lending standards, a more regulated banking environment, persistent immigration-driven demand, and chronic housing undersupply have all acted as structural buffers against the kind of deep, sustained price declines seen in other developed markets.
The current correction fits the same historical pattern. The national average sale price dipped -3.7% in 2023, recovered partially to +0.7% in 2024, then softened again to -1.5% in 2025 and -1.4% in 2026. Uncomfortable to watch month to month? Sure. Historically unusual for the Canadian residential market? Not really.
The Final Word
Forty-seven years of Canadian home price data tells one consistent story: this market grows. It corrects. It recovers. And it grows again. The specifics change with every cycle, the causes, the depth, the duration. But the direction, measured over any meaningful holding period, has been overwhelmingly upward. The current chapter is a correction. In the context of 47 years, its a short one. And the next chapter is already being written.
Frequently Asked Questions
What is the longest period Canadian home prices have ever risen consecutively?
The longest consecutive growth run in the 47-year CREA dataset is seven years, from 2001 through 2007, during which Canadian home prices rose every single year without exception. Annual appreciation ranged from +4.7% to +11.2% across that period. This run followed the mid-1990s correction and was supported by strong economic fundamentals, rising immigration, and a sustained low interest rate enviroment. A secondary consecutive run occurred from 2013 through 2017, producing five straight years of positive annual returns before the 2018 correction.
Which Canadian markets tend to recover fastest after a price correction?
Supply-constrained urban markets have historically led Canadian housing recoveries. Cities including Toronto, Vancouver, and Calgary, where developable land is limited and population growth is sustained through immigration, tend to see buyer demand return most quickly as affordability conditions improve and mortgage rates stabilize. CMHC data consistently shows that markets with the highest immigration-driven population growth and the most acute ownership housing undersupply experience the sharpest rebounds from correction lows. Smaller secondary markets and those with weaker economic fundamentals typically recover more slowly and less completely.
Have Canadian home prices ever failed to recover after a correction?
No. In 47 years of CREA MLS recorded data, every single Canadian housing market correction has been followed by a recovery. The corrections have varied in depth and duration, but none produced a prolonged multi-year collapse. The steepest single-year decline was -4.6% in 1995, and even that was followed by a stabilization period and then one of the longest sustained growth runs in the entire dataset. Canada's structural demand drivers, immigration, population growth, and chronic ownership undersupply, have consistently provided a price floor beneath correction cycles.
How long does it typically take for Canadian home prices to recover after a correction?
Recovery timelines in Canadian real estate vary depending on the cause and depth of the downturn. After the 2008 global financial crisis, recovery came within 12 months. Prices dropped -0.6% in 2008 and rebounded +5.0% in 2009. After the deeper mid-1990s correction, stabilization took longer, but the subsequent 2001 to 2007 growth run more than compensated sellers and buyers who held through the cycle. After the 2018 correction (-4.0%), recovery came within one year (+2.6% in 2019) before the pandemic-era price surge. Across the full dataset, the average recovery window is roughly 1 to 3 years.
Data Attribution: Annual price change data sourced from the CREA MLS national average price dataset (1980 to 2026). Supporting context drawn from the CMHC Housing Market Outlook, Bank of Canada rate decisions, TD Economics Provincial Housing Outlook, and Statistics Canada household net worth data.
Posted by Christopher Audette on
Leave A Comment