
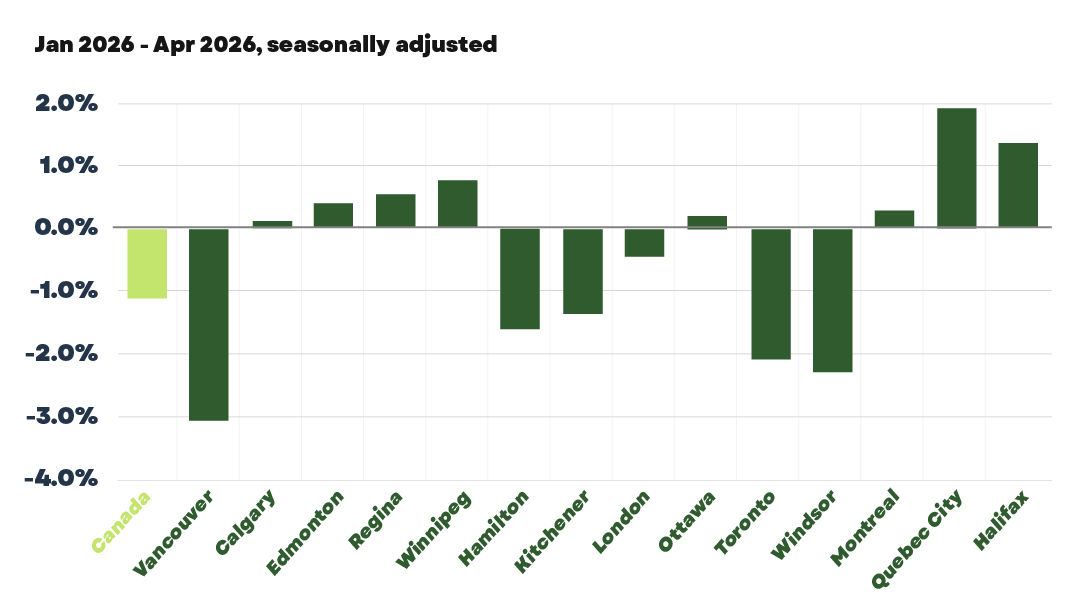
That's not a bait to get you to click, it’s just not an intentional lie. The problem is the headlines are answering the question. According to CREA's 3-month seasonally adjusted price data from January to April 2026, Vancouver has shed approximately 3.0% in home value while Halifax has gained 1.3%. Both are happening right now, in the same country, under the same interest rate environment. If you're making a real estate decision based on what "the Canadian market" is doing, you're asking the wrong question. The right question is: what is your city doing?
The National Average Is Lying to You
Canada's national 3-month price change sits at approximately -1.0% as of April 2026. That number is technically accurate and almost completely useless for anyone trying to make a real estate decision. Here's why: that -1.0% national figure is the averaged-out result of cities that are rising strongly and cities that are falling sharply. It doesn't describe any single market accurately. Not one.
The real picture, city by city, looks like this:
Rising markets (January to April 2026):
- Quebec City: +1.9% — strongest in Canada
- Halifax: +1.3% — second strongest
- Winnipeg: +0.8%
- Regina: +0.6%
- Edmonton: +0.4%
- Ottawa
Declining markets (January to April 2026):
- Vancouver: -3.0% — weakest in Canada
- Windsor: -2.3%
- Toronto: -2.2%
- Hamilton: -1.5%
- Kitchener: -1.3%
- Montreal: -0.8%
- Calgary: -0.1%
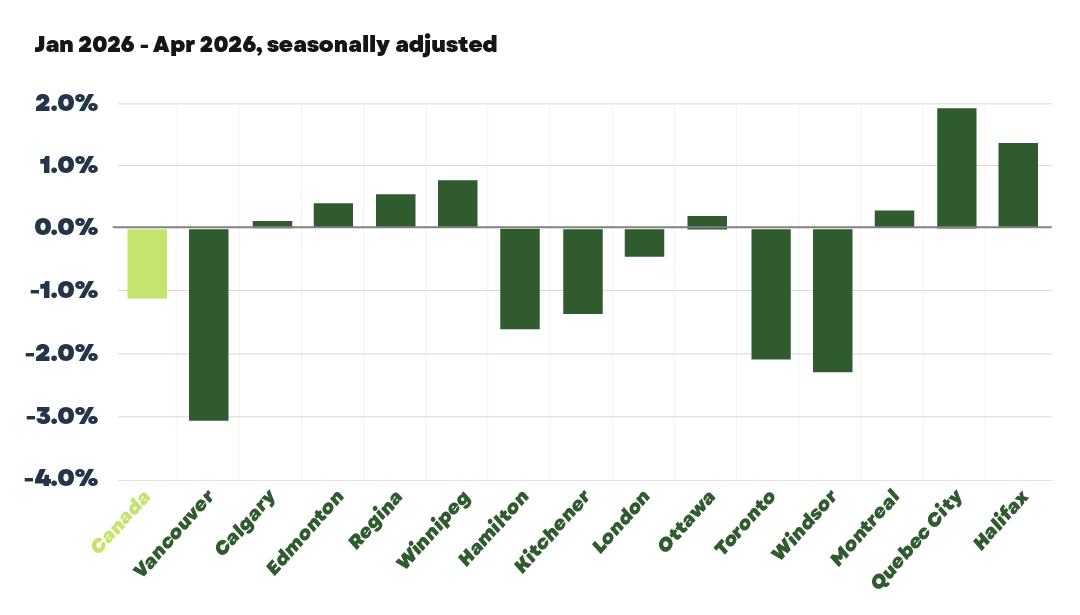
The gap between the best and worst performing cities in this CREA dataset is nearly 5 full percentage points over just three months. That is not one housing market. That is 14 different markets operating under completely different supply, demand, and affordability conditions. And the national average describes exactly none of them.
What's Driving the Winners
The cities posting positive price momentum in 2026 share a recognizable set of characteristics. Understanding them helps explain why these markets are holding up while others are sliding.
Relative affordability. Quebec City, Halifax, Winnipeg, and Regina all offer home prices that remain accessible to a broader pool of buyers even in a higher mortgage rate environment. When affordability is less stretched, buyer demand holds up better during rate-driven soft periods. Simple as that.
Employment stability. Atlantic Canada and Prairie cities have been adding payroll jobs year-over-year according to Statistics Canada's February 2026 data, directly supporting buyer confidence and mortgage qualification in these markets. The Halifax real estate market in 2026 isn't outperforming by accident. Its backed by real economic momentum.
Supply constraints. Quebec City in particular has a housing supply base that hasn't kept pace with growing buyer demand, a classic recipe for price support even when broader national market conditions are soft. If you're asking whether Quebec City is a good place to buy real estate right now, the supply and demand picture alone makes a compelling structural case.
In-migration momentum. Halifax continues to attract buyers relocating from Central Canada, drawn by lifestyle, relative affordability, and employment opportunities that have made Atlantic Canada one of Canada's most consistent real estate stories over the last four years. That interprovincial migration pipeline hasn't slowed down.
What's Driving the Losers
Vancouver, Toronto, Windsor, Hamilton, and Kitchener are all dealing with a different set of market conditions. Understanding the causes matters just as much as knowing the numbers.
Affordability exhaustion. The Vancouver real estate market in 2026 and the Toronto housing market both share the same root problem: both cities entered the current rate cycle at price levels that had dramatically outpaced income growth. Even modest rate increases significantly reduced the pool of buyers who can qualify at those price points. That's not a temporary fluctuation.
Correction from pandemic-era peaks. Both Vancouver and Southern Ontario markets saw extraordinary price appreciation in 2020 and 2021. The correction that followed has been deeper and longer in these markets than in cities that didn't experience the same degree of pandemic-era overheating. Anyone asking why Toronto home prices are falling in 2026 or why Hamilton and Kitchener are declining will find the same answer: the hangover from those peak years is still working its way through the resale market.
Sector-specific economic exposure. Windsor's -2.3% decline reflects a local economy heavily tied to automotive manufacturing and cross-border trade, sectors facing specific headwinds in early 2026 that have reduced buyer confidence and employment stability in the region. Windsor Ontario real estate in 2026 is carrying a weight that most other Canadian markets aren't.
What This Means If You're a Buyer
- If you're flexible on location, the CREA data is pointing clearly toward Quebec City, Halifax, Edmonton, and Winnipeg as markets where price momentum and affordability fundamentals are working in your favour right now.
- If you're buying in Vancouver or Toronto, you have more negotiating leverage than at any point in the past four years. Declining resale markets favour prepared, pre-approved buyers who can move on conditions and pricing that simply weren't available 24 months ago.
- The national average tells you nothing about your specific city. Always ask your agent for city-level comparable sales data and local absorption rates before making any purchase decision.
- Getting mortgage pre-approval now means you're ready to move the moment the right property appears. In both rising and falling markets, the prepared buyer consistently wins over the buyer still arranging financing.
See What's Available in the Markets That Are Moving
Quebec City is up nearly 2%. Halifax is up 1.3%. Edmonton and Winnipeg are gaining ground. If you're a buyer looking for markets where momentum is on your side, the CREA data is pointing you in a clear direction. Browse current listings or get pre-approved today.
What This Means If You're a Seller
- If you're selling in Quebec City, Halifax, or Winnipeg, the price momentum is working in your favour. Price confidently based on a current comparative market analysis (CMA) and don't undervalue what today's market is actually supporting.
- If you're selling in Vancouver, Toronto, or Windsor, precision pricing from day one is non-negotiable. Overpriced listings in declining markets accumulate days on market (DOM), generate low-ball offers, and ultimately sell for less than a well-priced listing would have from the start.
- The nearly 5-point gap between the best and worst performing cities means your counterpart in another province is having a completely different selling experience right now. Ignore national headlines. Focus on your city's specific comparable sales data.
- A current home valuation gives you the city-specific baseline you need to price accurately, set realistic expectations, and move decisively in whatever market you're in.
Find Out What Your Home Is Worth in Today's City-Specific Market
In a market where Vancouver is down 3% and Halifax is up 1.3%, your home's value depends entirely on where it sits, not what the national average says. Get a free, no-obligation home valuation and find out exactly where your property stands right now.
The Bottom Line
Vancouver is down 3%. Halifax is up 1.3%. Same country. Same interest rates. Same national headline. But completely different realities for buyers and sellers on the ground. The Canadian housing market in 2026 is not one story. It's 14 stories playing out simultaneously across 14 cities. Buyers and sellers who understand their specific city's story will make smarter, more confident decisions than those waiting for the national average to tell them something useful. It won't.
Find an Agent Who Knows Your City's Market
Canada's housing market isn't moving in one direction right now. It's moving in 14 different directions simultaneously. Whether your city is rising or falling, you need an agent who understands exactly what the local data means for your next move. Connect with a trusted local agent today.
Frequently Asked Questions
Which Canadian cities have rising home prices in 2026?
According to CREA 3-month seasonally adjusted price change data from January to April 2026, the cities posting positive price momentum are Quebec City (+1.9%), Halifax (+1.3%), Winnipeg (+0.8%), Regina (+0.6%), Edmonton (+0.4%), and Ottawa (+0.1%). These markets are outperforming both the national average (-1.0%) and major urban centres like Vancouver (-3.0%) and Toronto (-2.2%). The strongest performers share a common thread: relative affordability, stable payroll employment, and buyer demand that continues to outpace available resale supply.
Why are Vancouver and Toronto home prices falling in 2026?
Vancouver (-3.0%) and Toronto (-2.2%) are the two weakest major markets in the CREA January to April 2026 dataset. Both cities are experiencing the compounding effects of affordability constraints, elevated mortgage rates reducing buyer qualification, and an ongoing correction from pandemic-era price peaks that significantly outpaced income growth. Vancouver faces additional headwinds from softening condo market demand and cross-border economic uncertainty. Toronto's decline reflects a broader Southern Ontario softening that extends to Hamilton (-1.5%), Kitchener (-1.3%), and Windsor (-2.3%).
What does Canada's regional housing market divergence mean for sellers?
For sellers, Canada's city-level price divergence means national market commentary is almost irrelevant to your specific situation. A seller in Quebec City is operating in the country's strongest market right now. A seller in Vancouver is operating in the weakest. The gap between those two realities is nearly 5 percentage points over just three months. Pricing strategy must be anchored in current city-specific comparable sales data and local absorption rates, not national averages. In rising markets, confident pricing backed by a current CMA is appropriate. In declining markets, precision pricing from day one is the non-negotiable starting point for a successful transaction.
Data Attribution: 3-month house price change data sourced from CREA (Canadian Real Estate Association), seasonally adjusted, January to April 2026. Supporting context drawn from Statistics Canada payroll employment data (February 2026), CMHC Housing Market Outlook, and TD Economics Provincial Housing Outlook.
Posted by Christopher Audette on
Leave A Comment